


Catchment scale
The catchment scale is the most appropriate for land-use planning and flood risk management since the spatial extent of major rivers and tributaries where water flows crosses several administrative boundaries (from municipal to national ones). Moreover, being rivers naturally interconnected with bank ecosystems, floodplains and several water bodies, any perturbation located in a catchment can propagate to other locations according to water, sediments and energy fluxes.
The important role of catchments in water management activities is established in Italy by the law n. 183, 18 may 1989, which introduces the catchment authorities and similarly in European countries after the 60/2007/EC directive.
Regional/catchment-scale flood hazard assessment is usually evaluated by catchment authorities, which are in charge of producing flood hazard maps and issue the flood risk management plan (PGRA in Italy) in accordance with the 60/2007/EC directive.
Flood hazard maps are openly available in web GIS application of the catchment authorities and describe the territory according to an intensity scale of hazard. Flood hazard is classified according to the return period or recurrence interval. A return period is an estimate of the likelihood of an event, such as an earthquake, flood, landslide, or a river discharge flow to occur. It is a statistical measurement typically based on historic data denoting the average recurrence interval over an extended period of time, and is usually used for risk analysis. The analysis assumes that the probability of the event occurring does not vary over time and is independent of past events. The theoretical return period is the inverse of the probability that the event will be exceeded in any one year (or more accurately the inverse of the expected number of occurrences in a year). For example, a 10-year flood has a 1/10 = 0.1 or 10% chance of being exceeded in any one year and a 50-year flood has a 0.02 or 2% chance of being exceeded in any one year. This does not mean that a 100-year flood will happen regularly every 100 years, or only once in 100 years.
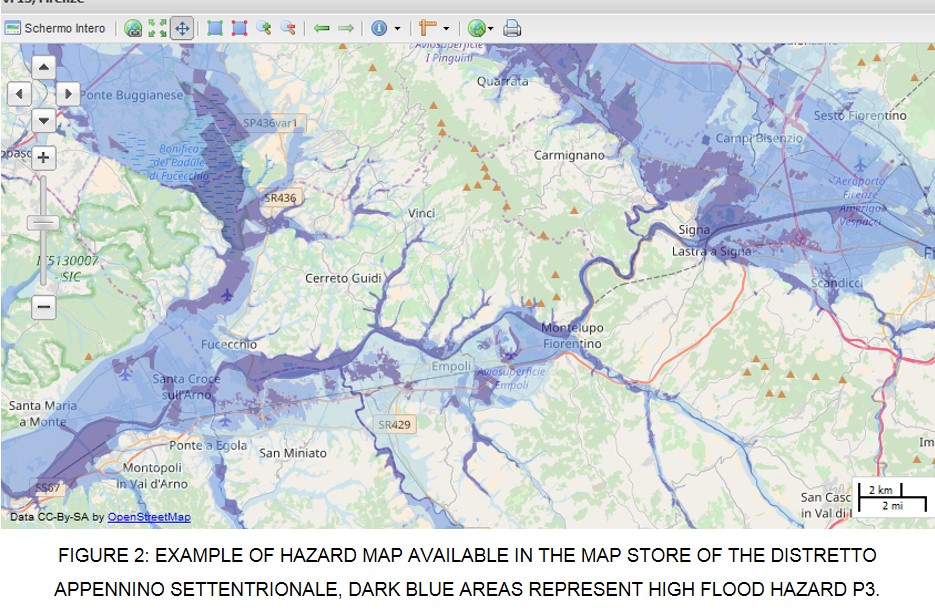
In the case of the Distretto Appennino Settentrionale (central Italy) there are three hazard classes (Fig. 2):
- • P1- low flood hazard: represents flood areas, which can be inundated with a recurrence interval higher than 200 years (rare event).
- • P2- medium flood hazard: represents flood areas, which can be inundated with a recurrence interval higher than 30 years but equal or lower than 200 years.
- • P3- high flood hazard: represents flood areas, which can be inundated with a recurrence interval lower than 30 years (frequent event)
The scale of analysis of such flood hazard maps is 1:10000 for the major rivers and 1:25000 for smaller tributaries. Two main steps are needed to obtain flood hazard maps, they are hydrologic and hydraulic modelling, which are described in the next sections. Hydrologic models usually maintain the same approach for any scale of hazard mapping, since the most important catchment phenomena have to be described, while hydraulic modelling approaches can vary significantly according to the scale of analysis as detailed in the next sections.