

Landscape/Regional scale
The method addressed as Probabilistic Seismic Hazard Analysis (PSHA), the most widespread in the assembling of earthquake hazard maps is fundamentally based on the work from Cornell (1968) and is implemented through several computer codes, e.g. FRISK (McGuire, 1978), SEISRISK III (Bender and Perkins, 1987), CRISIS99 (Ordaz et al., 1999).
The main assumptions at the base of PSHA postulated by Cornell (1968) are:
- • It is appropriate to express seismic risk in terms of return periods, similarly to what occurs for strong floods or design winds
- • Separation between seismologists and geologists from the earthquake engineer, which means that the engineer should have all the data in an adequate form to produce a wise judgment, by means of charts expressing e.g. a Modified Mercally intensity versus average return period for the area under investigation
The aim of Cornell’s method is to develop those “desired relationships between such ground motion parameters as MMI, PGV, PGA etc. and their average return period ” Conrnell, (1968), and the only thing the earthquake engineer needs from the seismologist is the professional judgment in a suitable form.
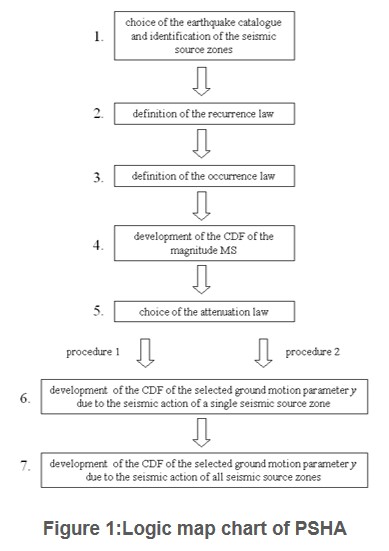
By means of PSHA the seismic hazard at a specific site (and so extending the process on an adequate grid of points for a wider territory) is estimated based on (a) the location of the site with respect to known or assumed earthquake sources, (b) the assumed recurrence behaviour of these earthquake sources, and (c) the ground motion evaluated for the site. More in detail, the PSHA, based on the method proposed in Conrnel 1968, develops in the following steps, Figure 1, as effectively systematised in Mulargia (2017), and here reported:
- 1. Identify seismically active regions, structures, and faults employing historical earthquake catalogues, together with geologic investigations, and geodetic strains. Operationally, this requires that the study area is subdivided into seismic source zones, which can be obtained by drawing a number of polygons over the reference territory. The polygons may have a complex geometry, reflecting the complexity of major tectonic trends, and cover areas within which seismicity is assumed to be homogeneously distributed in space and stationary in time (Woo, 1994)
- 2. For each seismic source, the average event rate is estimated, using both instrumental and historical seismicity data and geodetic strains. This step normally employs the Gutenberg-Richter Law, which relates magnitude to frequency
- 3. For each source, assuming a physical model, the average future occurrence rate is inferred
- 4. From the ground-motion prediction equation the spectrum from each source to the chosen site is attenuated by means of an empirical function;
- 5. Forecast the ground motion, expressed as an engineering variable such as the peak ground acceleration (PGA), assigning a probability of exceedance p or its reciprocal, the expected return period, T = 1/p, of a given level of shaking. For example, a 10 percent probability of exceedance in 50 years is equivalent to a return period of 475 years;
- 6. To take into account that various earthquake sources can invest a site, the exceedance probabilities of the different sources are summed;
- 7. The values of the ground motion parameter so evaluated can be employed as input value design the structure at hand
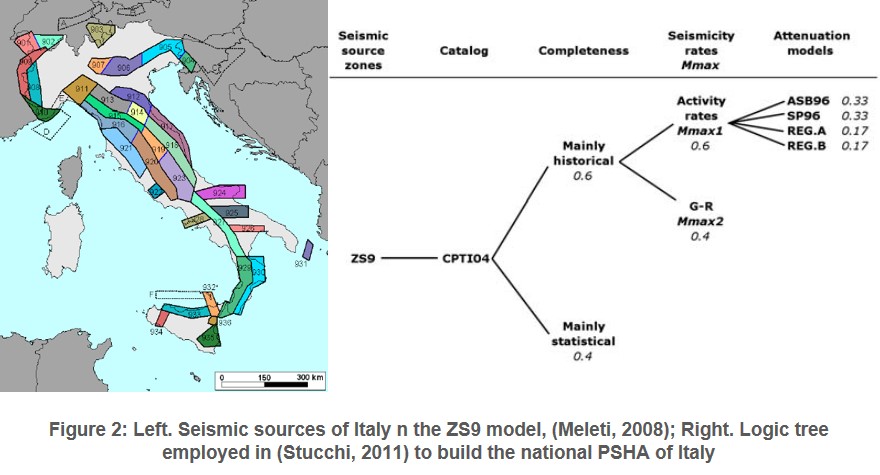
The seismic hazard assessment of Italy, with its recent updates (Stucchi et al., 2011), represents an internationally acknowledged example of PSHA, in which a conventional Cornell approach within a Poissonian distribution of the earthquake recurrence model was assumed. Basic innovations from the previous versions involved the use of a new source zone model ZS9, (Meletti et al. 2008), accounting for 36 seismic source zones, Figure 2 left, coupled with the use of the computer code SEISRISK III (Bender and Perking, 1987). The earthquake catalogue used at that time, CPTI04 (Gasperini et al., 2004), has been recently updated to CPTI15, (Rovida et al., 2016, Gasperini et a., 2013, Lolli et al., 2014), together with a new macro seismic database DBMI15 (Locati et al., 2016).
For the first time in Italy, a logic tree approach, reported in Figure 2 right, was adopted to balance the epistemic uncertainties in the completeness of the earthquake catalogue (two branches); two branches for magnitudes and seismicity rates, one of those observed form the catalogue and geological evidence and the other with Gutenberg-Richter rates from conservative assumptions. For the attenuation models, four branches have been weighted (Abraseys et al., 1996; Sabetta and Pugliese, 1996; and two ad hoc GMPEs, Montaldo et al. 2005). The reference territory was divided in a 5x5 km grid with resulting more than 16000 evaluation points, and for each of these the seismic hazard was computed for the median value (fiftieth percentile) and the 16th and 84th percentiles. Evaluations on both PGA values and spectral accelerations for several period make it possible to gain a point hazard maps, and not simply a seismic zoning.
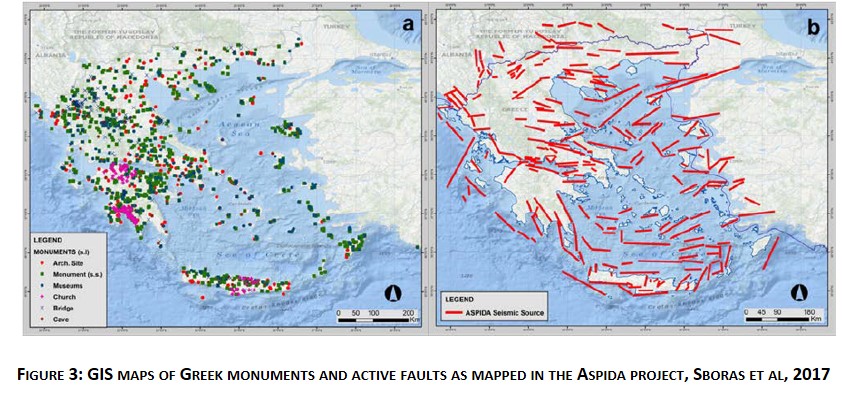
For cultural heritage, the seismic hazard should take in consideration credible levels of the shaking. As mentioned in the introductory section, the loss or damage of a monument should be avoided at all costs, thus, different assumptions, instead of the cost-benefit optimization, should be put forward. For this aim, the first added step necessary to define proper investigation strategies is to superpose geological and seismic source information to the geographic information system related to position of the sites of cultural interest (monuments, museums, archaeological sites, etc.) in the studied area. For these cases, if the extension of cultural heritage sites is at national scale, as for the case of Italy, or Greece, then dedicated seismic hazard investigation could be relevant to be carried out.
In the EU-funded project “Aspida”, (Sboras et al., 2017), geological and geotechnical maps have been superposed to the maps indicating the position of cultural heritage sites. Then, the EXSIM algorithm (Motazedian and Atkinson 2005), was employed to construct, for the whole national territory and for each source fault, a dedicated SHA in terms of PGA starting from Maximum Credible Earthquake magnitudes taken separately as proposed by (Wells and Coppersmith, 1994).